 Back to Menu
Iron Quantification MRI Assistant
1 · Measure
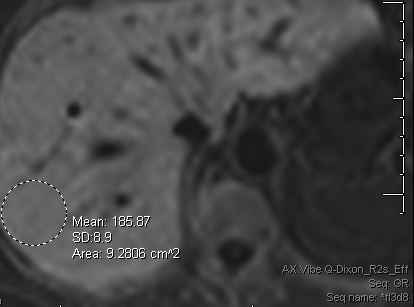
R2* map ROI- Use the AX VIBE Q-Dixon_R2s_Eff (R2*) map.
- Draw an ROI over liver parenchyma — avoid vessels, bile ducts, and the liver edge.
- Use that parenchymal ROI Mean — not the whole-liver mean (which includes vessels and overestimates).
2 · Calculate
LIC from R2* or T2*, at 1.5 T or 3 TLIC thresholds & reference
| LIC (mg Fe/g dry) | Iron burden | Chelation-therapy target |
|---|---|---|
| < 1.8 | Normal (upper 95% of normal) | — |
| 1.8 – <3.2 | Mild overload | Below target |
| 3.2 – 7.0 | Moderate overload | Within target — this is the generally accepted optimal range for a patient already on chelation therapy. For a chelation-naive patient, it is overload of a degree that usually prompts starting chelation or phlebotomy, not a reassuring result. |
| >7.0 – <15.0 | Severe overload | Above target; increased risk of iron-induced complications either way |
| ≥ 15.0 | Very severe overload | Well above target; greatly increased risk of cardiac disease and early death either way |
1.5 T: LIC = 0.0254 × R2* + 0.202 (Wood et al., Blood 2005;106:1460–5, equation 2; linear ~1.3–32.9 mg/g). By convention LIC is often taken as R2* ÷ 37.4, the slope of the same data; the result agrees within measurement error. 3 T: LIC = 0.0135 × R2* − 0.03 (multicenter, multivendor calibration; Hernando et al., Radiology 2022). R2* does not transfer between field strengths, so use the calibration for the magnet. T2*: R2* = 1000 ÷ T2* (ms). Vendor R2* maps agree with the reference reconstruction only up to about 330–525 s⁻¹ at 1.5 T and 700–800 s⁻¹ at 3 T (Simchick et al., JMRI 2025), so very high values may be underestimated. Severity bands and the 3.2–7.0 mg/g chelation target follow Wood 2005; the target describes a treatment goal, not a severity scale. Cardiac T2*: under 20 ms raised arrhythmia risk 4.6-fold and under 10 ms heart-failure risk 160-fold; 47% developed heart failure within a year of T2* under 6 ms (Kirk et al., Circulation 2009).
The physics & pitfalls (fellow / attending level)
Why iron shortens R2*. Storage iron (ferritin/hemosiderin) is paramagnetic and creates local magnetic-field inhomogeneities within and around hepatocytes and Kupffer cells. Protons diffusing through these field gradients dephase faster, shortening T2* (and, to a lesser degree, true T2). R2* = 1/T2* rises roughly linearly with tissue iron concentration over a wide range, which is what makes it usable as a quantitative biomarker rather than just a qualitative "the liver looks dark" observation.
Why R2* instead of R2. Multi-echo gradient-echo R2* is a single breath-hold (~1–2 min), whereas the alternative spin-echo R2 technique (FerriScan, St Pierre calibration) takes considerably longer. The trade-off is that R2* is more sensitive to non-iron confounders (below). At very high iron burden, R2* decay can be fast enough that later echoes fall into the noise floor, destabilizing the fit and biasing the estimate low — R2/FerriScan remains a reasonable second-line technique when a R2* fit looks unreliable at the top of the range.
Fat is the main confounder — and why this specific sequence matters. Hepatic steatosis independently shortens apparent T2* through chemical-shift signal loss at out-of-phase echo times, which would overestimate iron content if the ROI came from an ordinary (non-fat-separated) multi-echo GRE. The Dixon-based R2s_Eff map used here is fat-water separated and fat-corrected — that's why the ROI should be drawn on this map rather than a generic in/out-of-phase GRE series.
Field strength is not portable. R2* scales roughly linearly with field strength for a given tissue iron concentration. The 37.4 Hz per mg/g calibration used here (Wood et al. 2005) is for 1.5 T only — plugging a 3 T R2* value into this formula overestimates LIC by roughly a factor of two. Confirm field strength before using this calculator, and use a 3 T-specific calibration when scanning at 3 T.
ROI pitfalls. Avoid segment VIII/IVa near the cardiac base (motion and susceptibility from the adjacent lung/heart spuriously elevate R2*), avoid vessels and bile ducts, and avoid the liver edge/diaphragm interface. A large parenchymal ROI (roughly 2–3 cm²) placed centrally in the right lobe is standard practice.
Distribution pattern still matters. Transfusional (secondary) iron overload typically raises both hepatic and splenic R2*, reflecting reticuloendothelial iron loading. Hereditary hemochromatosis classically spares the spleen, since its iron deposition is parenchymal (hepatocellular) rather than reticuloendothelial — an iron-loaded liver with a normal spleen should raise suspicion for a primary/genetic cause rather than transfusional overload.
Other confounders. Recent gadolinium administration, hemosiderin-laden granulomatous disease, and any other paramagnetic or superparamagnetic material within the imaging volume elevate R2* independent of true iron burden — check recent contrast history and clinical context before over-interpreting a borderline value.
Cardiac T2* (optional). How: a cardiac-gated, single breath-hold multi-echo gradient echo (about 8 echoes, 2.6–17 ms) of one mid-ventricular short-axis slice, with a large ROI in the interventricular septum away from the coronary veins, which cause susceptibility artifact (Kirk et al., Circulation 2009). Why: the heart loads iron on its own schedule, and myocardial iron is not predicted by liver iron or serum ferritin (Anderson et al., Eur Heart J 2001), yet it is what drives heart failure and arrhythmia in transfusion-dependent anemias. Bands (1.5 T): ≥20 ms normal; under 20 ms arrhythmia risk 4.6-fold; under 10 ms heart-failure risk 160-fold; under 6 ms, 47% developed heart failure within a year. At 3 T T2* is shorter and these bands do not apply. Optional because it needs a dedicated gated sequence that a routine liver iron exam does not include.