 Back to Menu
🌊
MR Elastography Assistant
Liver MRE — quality check, ROI guidance, and the weighted-mean stiffness calculation.
1 · Was the exam done properly?
confirm each before measuring2 · QA the tech's ROIs
ROIs are placed by the MRI tech — verify before measuringConfirm
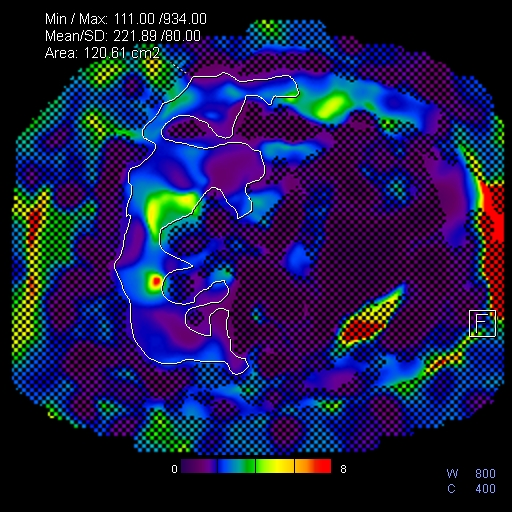
- An ROI on each of the 4 slices, in the largest portion of liver.
- Outer margin parallel to the liver edge, ≥1 cm from the capsule.
- Inner margin excludes the 95% confidence crosshatch.
- Each ROI larger than ~a postage stamp, with little to no checkerboard inside.
- Mean and Area reported for each ROI (Min/Max/Mean/SD/Area visible).
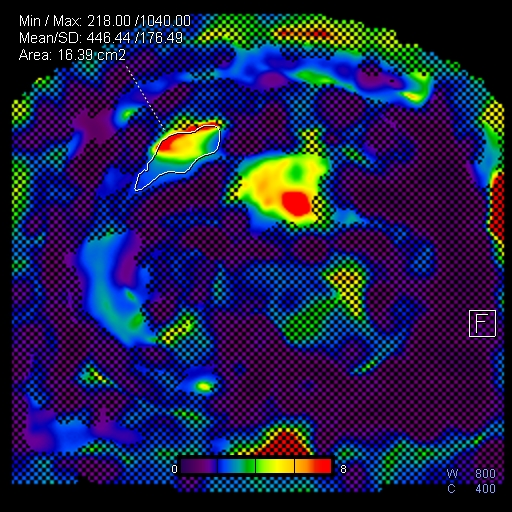
Flag / re-measure if an ROI includes
- The 95% confidence crosshatch.
- Liver edge (<1 cm), fissures, gallbladder fossa, or large vessels.
- Left lobe with motion artifact.
- Hot spots — passive-driver or liver-dome (falsely high stiffness).
- Low-amplitude / distorted waves or color-map “hot” areas.
Good exampleimg/mre-roi-good.png
Poor exampleimg/mre-roi-bad.png
3 · Weighted-mean stiffness
ROI Mean weighted by Area| ROI Mean | Area (cm²) |
|---|
Enter the ROI Mean as shown on PACS (e.g., 208) and the Area. Weighted average = Σ(Mean × Area) ÷ Σ(Area); the result is divided by 100 to give stiffness in kPa.
— kPa
liver stiffness
Enter at least one ROI Mean and Area.
Copy to report
—
Copy to impression
—
Reference — QC, fibrosis thresholds, citation
Fibrosis stage thresholds (MRE at 60 Hz)
| Mean stiffness | Interpretation |
|---|---|
| < 2.5 kPa | Normal |
| 2.5 – 2.9 kPa | Normal or inflammation |
| 2.9 – 3.5 kPa | Stage 1–2 fibrosis |
| 3.5 – 4 kPa | Stage 2–3 fibrosis |
| 4 – 5 kPa | Stage 3–4 fibrosis |
| > 5 kPa | Stage 4 fibrosis or cirrhosis |
Broad categories; interpret with clinical and laboratory findings. Non-fibrotic causes of increased stiffness include acute hepatitis, acute biliary obstruction, passive hepatic congestion, infiltrative disease, and the postprandial state — most confounders raise (not lower) stiffness, so a normal value is generally reliable.
If nondiagnostic
The patient has usually already left. Discuss with the MRI leads about bringing them back for “Additional Views” (ordering instructions are in the Body folder).
Thresholds: Venkatesh SK, Ehman RL. Magn Reson Imaging Clin N Am 2014;22(3):433–446. Technique/QC/ROI: Guglielmo FF, Venkatesh SK, Mitchell DG, RadioGraphics educational review.